


Our six senior AI creative experts strategise, advise and review your work, right on the page. Just like a real team.
The era of “just add more traffic” is officially over. In 2026, with ad costs stabilizing at record highs and organic reach fragmented by AI overviews, the only sustainable lever for growth is efficiency. If you are paying for 100 visitors and 98 of them leave without buying, your problem isn’t marketing; it is friction.
Learning how to increase conversion rate isn’t about changing button colors or deploying “urgent” countdown timers; it is about the disciplined removal of barriers between your user and the value you promise. But here is the reality most teams miss. Conversion failures are rarely technical. They are collaborative. The designer builds a beautiful modal, the developer implements it in a way that blocks the checkout on mobile, and marketing writes copy that doesn’t fit the layout.
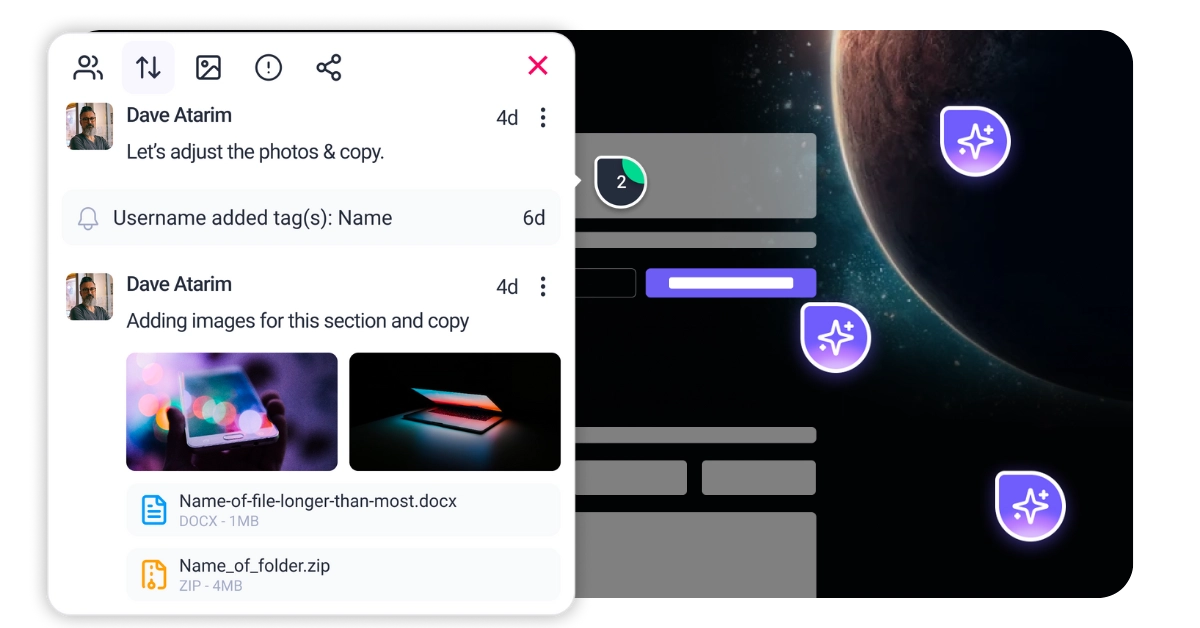
Atarim solves this “translation error” by acting as the collaboration layer for your live website. Instead of fighting through screenshots and email chains, your team can point, click, and fix issues directly on the URL. This unifies design, code, and copy to turn feedback into finished features faster.
You cannot fix what you do not measure. A structured audit typically reveals that “low conversion” is a symptom of three distinct underlying illnesses. Before you change a single pixel, analyse these three pillars to understand where your funnel is leaking.
Since the European Accessibility Act (EAA) reached full enforcement in June 2025, accessibility is no longer optional; it is a legal and commercial baseline. An accessible site is simply a usable site. You must evaluate navigation flow, color contrast, and keyboard navigability. If a user cannot navigate your menu with a Tab key, you aren’t just risking a fine. You are actively blocking roughly 15% of your potential revenue.
In the Atarim workflow, Navi (your UX pathfinder) scans for these critical gaps, identifying exactly where users are hitting dead ends.
Confusion is the number one cause of bounces. Users decide within 3 seconds whether they are in the right place. Analyse your headlines. Are they clever, or are they clear? Does your value proposition align with the ad the user just clicked? If you promise “Instant Quotes” in the ad but the landing page says “Contact Us,” you have broken the promise before the interaction began.
This is where Lexi (your copy editor) helps refine tone and clarity, ensuring your copy speaks to the user’s intent rather than just filling space.
(Total Conversions / Total Sessions) * 100. For example, if you had 50 sales from 2,000 visitors, your conversion rate is 2.5%. Be sure to measure this per channel, as email traffic often converts much higher than social traffic. 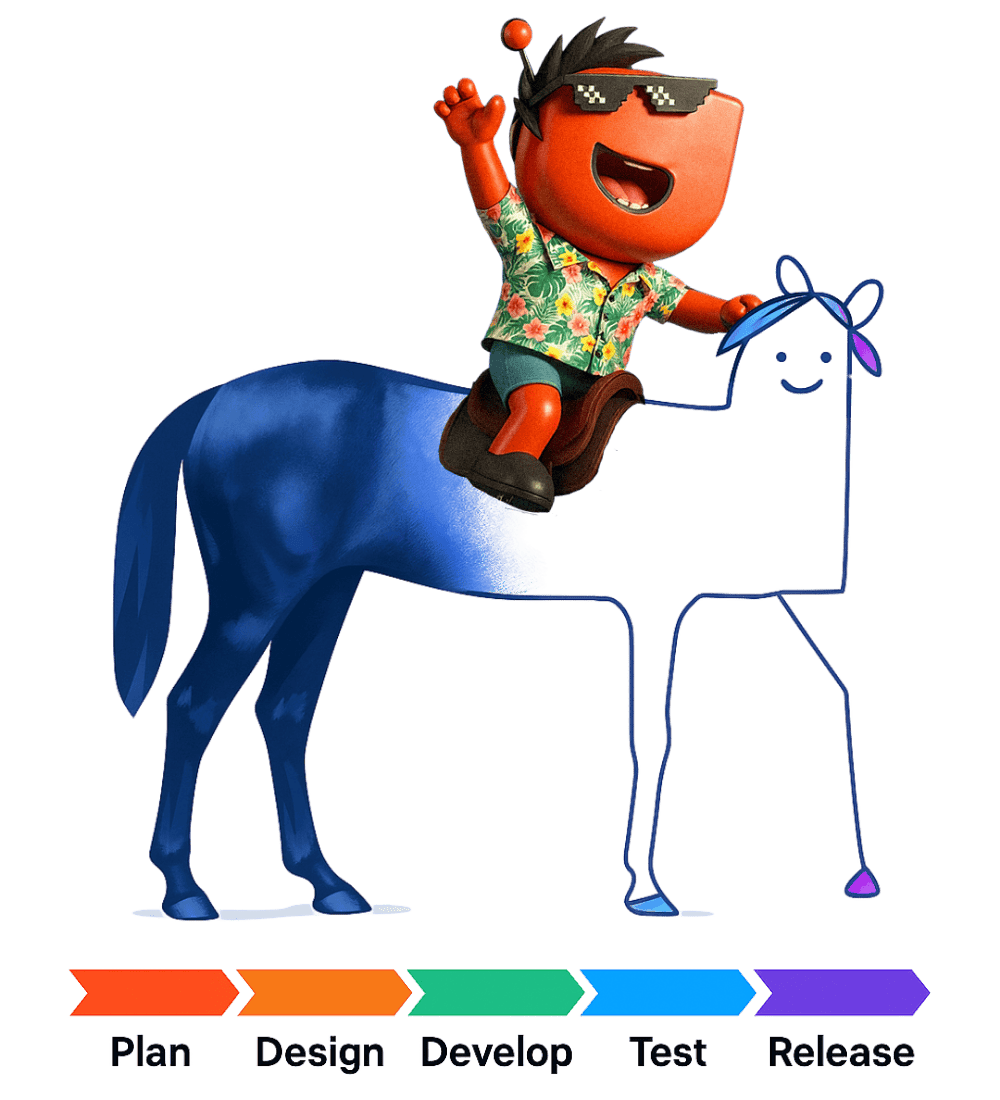


| Cookie | Duration | Description |
|---|---|---|
| __stripe_mid | 1 year | This cookie is set by Stripe payment gateway. This cookie is used to enable payment on the website without storing any patment information on a server. |
| __stripe_sid | 30 minutes | This cookie is set by Stripe payment gateway. This cookie is used to enable payment on the website without storing any patment information on a server. |
| cookielawinfo-checkbox-advertisement | 1 year | The cookie is set by GDPR cookie consent to record the user consent for the cookies in the category "Advertisement". |
| cookielawinfo-checkbox-analytics | 11 months | This cookie is set by GDPR Cookie Consent plugin. The cookie is used to store the user consent for the cookies in the category "Analytics". |
| cookielawinfo-checkbox-functional | 11 months | The cookie is set by GDPR cookie consent to record the user consent for the cookies in the category "Functional". |
| cookielawinfo-checkbox-necessary | 11 months | This cookie is set by GDPR Cookie Consent plugin. The cookies is used to store the user consent for the cookies in the category "Necessary". |
| cookielawinfo-checkbox-others | 11 months | This cookie is set by GDPR Cookie Consent plugin. The cookie is used to store the user consent for the cookies in the category "Other. |
| cookielawinfo-checkbox-performance | 11 months | This cookie is set by GDPR Cookie Consent plugin. The cookie is used to store the user consent for the cookies in the category "Performance". |
| elementor | never | This cookie is used by the website's WordPress theme. It allows the website owner to implement or change the website's content in real-time. |
| PHPSESSID | session | This cookie is native to PHP applications. The cookie is used to store and identify a users' unique session ID for the purpose of managing user session on the website. The cookie is a session cookies and is deleted when all the browser windows are closed. |
| viewed_cookie_policy | 11 months | The cookie is set by the GDPR Cookie Consent plugin and is used to store whether or not user has consented to the use of cookies. It does not store any personal data. |
| wordpress_test_cookie | session | This cookie is used to check if the cookies are enabled on the users' browser. |
| Cookie | Duration | Description |
|---|---|---|
| aka_debug | session | This cookie is set by the provider Vimeo.This cookie is essential for the website to play video functionality. The cookie collects statistical information like how many times the video is displayed and what settings are used for playback. |
| bp_user-registered | 13 years 8 months 8 days | This cookie is used to set which users can access the private pages of the website. It is a functional cookie. |
| bp_user-role | 13 years 8 months 8 days | This is a functional cookie. It is used to set restriction to the user on acessing certain pages like back office, account page etc. |
| bp_ut_session | 13 years 8 months 8 days | This is a functional cookie. This cookie is used to set restriction to the user on acessing certain pages like back office, account page etc. |
| player | 1 year | This cookie is used by Vimeo. This cookie is used to save the user's preferences when playing embedded videos from Vimeo. |
| Cookie | Duration | Description |
|---|---|---|
| _fs | 16 years 4 months 18 days 5 hours 26 minutes | This cookie is provided by Google Tag Manager. This cookie is used for collecting information on user preferences and the behaviour with web campaign content. This is used by website owners for promoting products and events. |
| Cookie | Duration | Description |
|---|---|---|
| _ga | 2 years | This cookie is installed by Google Analytics. The cookie is used to calculate visitor, session, campaign data and keep track of site usage for the site's analytics report. The cookies store information anonymously and assign a randomly generated number to identify unique visitors. |
| _gat_gtag_UA_187048114_1 | 1 minute | This cookie is set by Google and is used to distinguish users. |
| _gid | 1 day | This cookie is installed by Google Analytics. The cookie is used to store information of how visitors use a website and helps in creating an analytics report of how the website is doing. The data collected including the number visitors, the source where they have come from, and the pages visted in an anonymous form. |
| _hjAbsoluteSessionInProgress | 30 minutes | No description available. |
| _hjFirstSeen | 30 minutes | This is set by Hotjar to identify a new user’s first session. It stores a true/false value, indicating whether this was the first time Hotjar saw this user. It is used by Recording filters to identify new user sessions. |
| _hjid | 1 year | This cookie is set by Hotjar. This cookie is set when the customer first lands on a page with the Hotjar script. It is used to persist the random user ID, unique to that site on the browser. This ensures that behavior in subsequent visits to the same site will be attributed to the same user ID. |
| _hjIncludedInPageviewSample | 2 minutes | No description available. |
| CONSENT | 16 years 4 months 18 days 5 hours 24 minutes | These cookies are set via embedded youtube-videos. They register anonymous statistical data on for example how many times the video is displayed and what settings are used for playback.No sensitive data is collected unless you log in to your google account, in that case your choices are linked with your account, for example if you click “like” on a video. |
| vuid | 2 years | This domain of this cookie is owned by Vimeo. This cookie is used by vimeo to collect tracking information. It sets a unique ID to embed videos to the website. |
| Cookie | Duration | Description |
|---|---|---|
| _fbp | 3 months | This cookie is set by Facebook to deliver advertisement when they are on Facebook or a digital platform powered by Facebook advertising after visiting this website. |
| fr | 3 months | The cookie is set by Facebook to show relevant advertisments to the users and measure and improve the advertisements. The cookie also tracks the behavior of the user across the web on sites that have Facebook pixel or Facebook social plugin. |
| IDE | 1 year 24 days | Used by Google DoubleClick and stores information about how the user uses the website and any other advertisement before visiting the website. This is used to present users with ads that are relevant to them according to the user profile. |
| test_cookie | 15 minutes | This cookie is set by doubleclick.net. The purpose of the cookie is to determine if the user's browser supports cookies. |
| VISITOR_INFO1_LIVE | 5 months 27 days | This cookie is set by Youtube. Used to track the information of the embedded YouTube videos on a website. |
| YSC | session | This cookies is set by Youtube and is used to track the views of embedded videos. |
| yt-remote-connected-devices | never | These cookies are set via embedded youtube-videos. |
| yt-remote-device-id | never | These cookies are set via embedded youtube-videos. |
| yt.innertube::nextId | never | These cookies are set via embedded youtube-videos. |
| yt.innertube::requests | never | These cookies are set via embedded youtube-videos. |
| Cookie | Duration | Description |
|---|---|---|
| _bento_session | 7 days | No description |
| bento_events | 17 hours | No description |
| bento_visit_id | 5 hours | No description |
| bento_visitor_id | session | No description |
| GetLocalTimeZone | session | No description |
| gist_id_jquk4gak | 1 year | No description |
| gist_identified_jquk4gak | 1 year | No description |
| gscs | never | No description available. |
| jilt_customer_session_id | never | No description available. |
| jilt_utm | 7 days | No description |
| loglevel | never | No description available. |
| m | 2 years | No description available. |
| sync_active | never | No description available. |
| undefined | never | No description available. |
| wordpress_87c01d6ccf9faf56036dce5d241c08ac | past | No description |
| wordpress_logged_in_87c01d6ccf9faf56036dce5d241c08ac | past | No description |
| wordpress_sec_87c01d6ccf9faf56036dce5d241c08ac | past | No description |
| wordpresspass_87c01d6ccf9faf56036dce5d241c08ac | past | No description |
| wordpressuser_87c01d6ccf9faf56036dce5d241c08ac | past | No description |
| wp-postpass_87c01d6ccf9faf56036dce5d241c08ac | past | No description |
| wp-settings-0 | past | No description |
| wp-settings-time-0 | past | No description |